

The three longest established and most influential global rankings are those produced by Quacquarelli Symonds (QS), Times Higher Education (THE) and ShanghaiRanking Consultancy (ARWU). All of these, along with other global rankings, primarily measure the research performance of universities rather than their teaching. They have been criticized for being “largely based on what can be measured rather than what is necessarily relevant and important to the university”, and the validity of the data available globally has been questioned.
However, despite the criticism, much attention is paid to global rankings, particularly ARWU, QS, and THE. Some countries, including Denmark and the Netherlands, use university rankings as part of points-based immigration programs, while others, such as Russia, automatically recognize degrees from higher-ranked universities. India’s University Grants Commission requires foreign partners of Indian universities to be ranked in the top 500 of the THE or ARWU ranking, while Brazil’s Science Without Borders program selected international partner institutions using the THE and QS rankings.
Here, we give you insights on the raking methodologies adopted in the three major global rankings ARWU, QS, and THE.
ARWU ranking methodology
ARWU considers every university that has any Nobel Laureates, Fields Medalists, Highly Cited Researchers, or papers published in Nature or Science. In addition, universities with significant amount of papers indexed by Science Citation Index-Expanded (SCIE) and Social Science Citation Index (SSCI) are also included. In total, more than 1800 universities are actually ranked and the best 1000 are published.
Universities are ranked by several indicators of academic or research performance. For each indicator, the highest scoring institution is assigned a score of 100, and other institutions are calculated as a percentage of the top score. The distribution of data for each indicator is examined for any significant distorting effect; standard statistical techniques are used to adjust the indicator if necessary. Scores for each indicator are weighted as shown below to arrive at a final overall score for an institution. The highest scoring institution is assigned a score of 100, and other institutions are calculated as a percentage of the top score. An institution’s rank reflects the number of institutions that sit above it.
Indicators and Weights for ARWU
| Criteria | Indicator | Code | Weight | |
|---|---|---|---|---|
| Quality of Education | Alumni of an institution winning Nobel Prizes and Fields Medals | Alumni | 10% | |
| Quality of Faculty | Staff of an institution winning Nobel Prizes and Fields Medals | Award | 20% | |
| Highly Cited Researchers | HiCi | 20% | ||
| Research Output | Papers published in Nature and Science* | N&S | 20% | |
| Papers indexed in Science Citation Index-Expanded and Social Science Citation Index | PUB | 20% | ||
| Per Capita Performance | Per capita academic performance of an institution | PCP | 10% | |
| Total | 100% | |||
| * For institutions specialized in humanities and social sciences such as London School of Economics, N&S is not considered, and the weight of N&S is relocated to other indicators. | ||||
| Indicator | Definition |
|---|---|
| Alumni | The total number of the alumni of an institution winning Nobel Prizes and Fields Medals. Alumni are defined as those who obtain bachelor’s, master’s or doctoral degrees from the institution. Different weights are set according to the periods of obtaining degrees. The weight is 100% for alumni obtaining degrees after 2011, 90% for alumni obtaining degrees in 2001-2010, 80% for alumni obtaining degrees in 1991-2000, and so on, and finally 10% for alumni obtaining degrees in 1921-1930. If a person obtains more than one degrees from an institution, the institution is considered once only. |
| Award | The total number of the staff of an institution winning Nobel Prizes in Physics, Chemistry, Medicine and Economics and Fields Medal in Mathematics. Staff is defined as those who work at an institution at the time of winning the prize. Different weights are set according to the periods of winning the prizes. The weight is 100% for winners after 2011, 90% for winners in 2001-2010, 80% for winners in 1991-2000, 70% for winners in 1981-1990, and so on, and finally 10% for winners in 1921-1930. If a winner is affiliated with more than one institution, each institution is assigned the reciprocal of the number of institutions. For Nobel prizes, if a prize is shared by more than one person, weights are set for winners according to their proportion of the prize. |
| HiCi | The number of Highly Cited Researchers selected by Clarivate Analytics. Only the primary affiliations of Highly Cited Researchers are considered. |
| N&S | The number of papers published in Nature and Science over 5 years. To distinguish the order of author affiliation, a weight of 100% is assigned for corresponding author affiliation, 50% for first author affiliation (second author affiliation if the first author affiliation is the same as corresponding author affiliation), 25% for the next author affiliation, and 10% for other author affiliations. When there are more than one corresponding author addresses, we consider the first corresponding author address as the corresponding author address and consider other corresponding author addresses as first author address, second author address etc. following the order of the author addresses. Only publications of ‘Article’ type is considered. |
| PUB | Total number of papers indexed in Science Citation Index-Expanded and Social Science Citation Index. Only publications of ‘Article’ type is considered. When calculating the total number of papers of an institution, a special weight of two was introduced for papers indexed in Social Science Citation Index. |
| PCP | The weighted scores of the above five indicators divided by the number of full-time equivalent academic staff. If the number of academic staff for institutions of a country cannot be obtained, the weighted scores of the above five indicators is used. |
QS ranking methodology
The QS World University Rankings has a consistent methodological framework, compiled using six simple metrics that are believed to effectively capture university performance.
 Academic reputation (40%)
The highest weighting of any metric is allotted to an institution’s academic reputation score, which is based on academic survey of over 100,000 individuals in the higher education space regarding teaching and research quality at the world’s universities.
 Employer reputation (10%)
The employer reputation metric is based on almost 50,000 responses to QS employer survey, and asks employers to identify those institutions from which they source the most competent, innovative, effective graduates. The QS employer survey is also the world’s largest of its kind.
 Faculty / Student ratio (20%)
Teaching quality is typically cited by students as the metric of highest importance to them when comparing institutions using a ranking. The measuring teacher/student ratios is the most effective proxy metric for teaching quality. It assesses the extent to which institutions are able to provide students with meaningful access to lecturers and tutors, and recognizes that a high number of faculty members per student will reduce the teaching burden on each individual academic.
 Citations per faculty (20%)
The citations per faculty metric is calculated by taking the total number of citations received by all papers produced by an institution across a five-year period by the number of faculty members at that institution. All citations data is sourced using Elsevier’s Scopus database, the world’s largest repository of academic journal data.
To account for the fact that different fields have very different publishing cultures, citations are normalized. This means that a citation received for a paper in Philosophy is measured differently to one received for a paper on Anatomy and Physiology, ensuring that, in evaluating an institution’s true research impact, both citations are given equal weight.
 International faculty ratio / international student ratio (5% each)
A highly international university demonstrates an ability to attract faculty and students from across the world, which in turn suggests that it possesses a strong international brand. It implies a highly global outlook: essentially for institutions operating in an internationalized higher education sector. It also provides both students and staff alike with a multinational environment, facilitating exchange of best practices and beliefs. In doing so, it provides students with international sympathies and global awareness: soft skills increasingly valuable to employers. Both of these metrics are worth 5% of the overall total.
THE ranking methodology
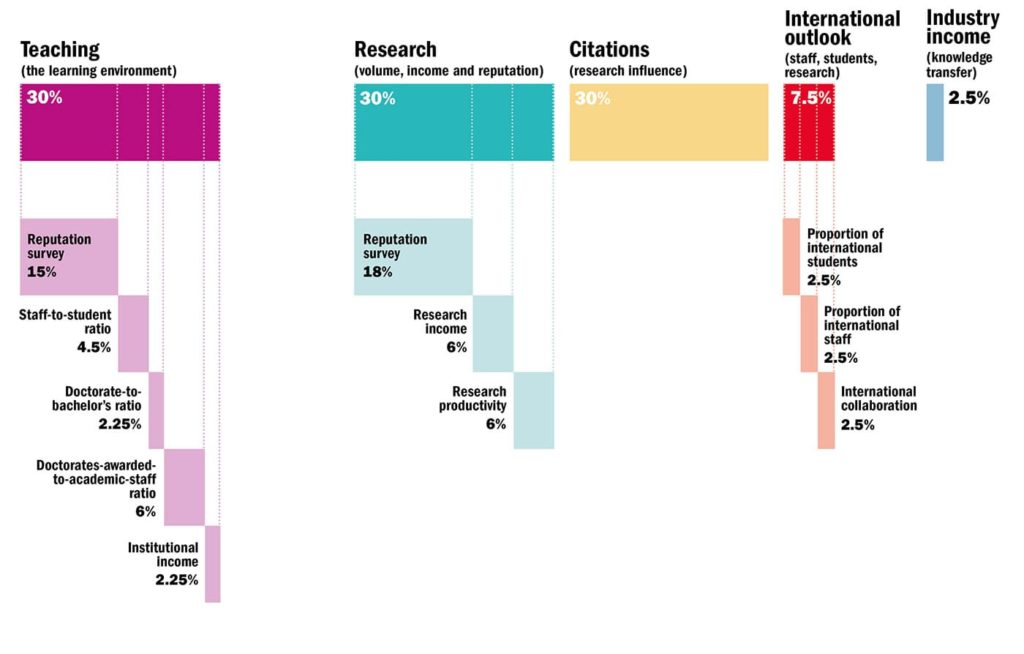
THE uses 13 carefully calibrated performance indicators to provide the most comprehensive and balanced comparisons, trusted by students, academics, university leaders, industry and governments. The performance indicators are grouped into five areas: Teaching (the learning environment); Research (volume, income and reputation); Citations (research influence); International outlook (staff, students and research); and Industry Income (knowledge transfer).
Teaching – the learning environment (30%)
The teaching performance indicator is calculated as sum of the academic reputation survey (15%), which examines the perceived prestige of institutions in teaching, the staff-to-student ration (4.5%), the doctorate-to-bachelor’s ratio (2.25%), which is assesses how committed an institution is to nurturing the next generation of academics, the doctorates-awarded-to-academic-staff ratio (6%), and the institutional income (2.25%), which is scaled against academic staff numbers and normalized for purchasing-power parity (PPP). It indicates an institution’s general status and gives a broad sense of the infrastructure and facilities available to students and staff.
Research – volume, income and reputation (30%)
The most prominent indicator in this category looks at a university’s reputation for research excellence among its peers, based on the responses to annual academic reputation survey (18%). Research income (6%) is scaled against academic staff numbers and adjusted for PPP and fully normalized to take account of each university’s distinct subject profile. The final indicator in this area is research productivity, which counts the number of publications published in the academic journals indexed by Elsevier’s Scopus database per scholar, scaled for institutional size and normalized for subject.
Citations – research influence (30%)
The research influence indicator looks at universities’ role in spreading new knowledge and ideas and is calculated by capturing the average number of times a university’s published work is cited by scholars globally. Elsevier’s Scopus database and all indexed publications (journal articles, article reviews, conference proceedings, books and book chapters) are examined over five years.
International outlook – staff, students, research (7.5%)
Three indicators i.e. proportion of international students (2.5%), proportion of international staff (2.5%), and international collaboration (2.5%) count for the international look of the university. The international collaboration indicator represents the proportion of a university’s total research journal publications that have at least one international co-author and reward higher volumes.
Industry income – technology transfer (2.5%)
The industry income indicator seeks to capture the knowledge-transfer activity of a university by looking at how much research income an institution earns from industry (adjusted for PPP), scaled against the number of academic staff it employs. The indicator suggests the extent to which businesses are willing to pay for research and a university’s ability to attract funding in the commercial marketplace – useful indicators of institutional quality.
By Issam Oueslati - Last updated on June 28, 2020
